
Marginal population growth predicted for Fairfax County
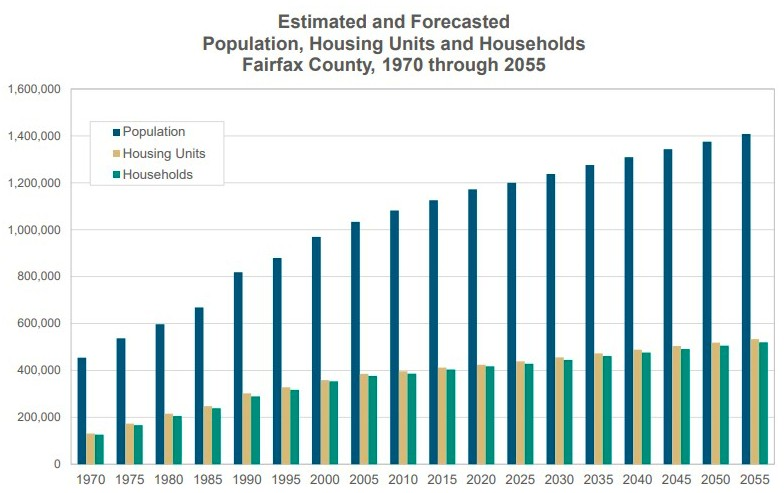
Fairfax County has experienced marginal population growth between 2024 and 2025, while the median home market value rose by more than 6%.
Those are some of the major findings in the county’s just-released demographic report for 2025 by the Department of Management and Budget.
Here are some key statistics from the 225-page report:
- The county’s total population was 1,199,700 in 2025, an increase of just 0.3% from the previous year.
- The population is expected to grow by 0.5% to 0.6% annually through 2055.
- The county had 438,700 total housing units last year and 428,400 total households.
- The median age of residents has been steadily increasing, from 25.2 years in 1970 to 38.3 years in 2020.
- Seniors make up the largest age category. The percent of the population age 65 and over was 15.9 in 2025 and is expected to rise to 23.9 in 2045.
- The racial and ethnic mix has also changed in the past 20 years. Between 2000 and 2020, the percentage of Whites has declined from 69.9% to 49.5%. The Black population has gone from 8.6% to 9.6%. The biggest increases were among Asian and Pacific Islanders (13.1% to 20.5%) and Hispanics (11.0% to 17.3%). The percent of people listed as “other” increased from 8.2 to 19.8.
- In 2024, 36.4% of households and 44.8% of families had an income of $200,000 or more. The median household income was $154,545 in 2024, up from $141,553 in 2023. Among other jurisdictions in the DMV, only Loudoun County had a higher median household income.
- The average monthly rent for multifamily housing has climbed from $1,787 in 2020 to $2,092 in 2024.
- The estimated median market value of owned housing units has gone up from $648,270 in 2022 to $708,383 in 2025.
- In Mason District, the median market value of owned housing units was $694,496 in 2025, up 6.4% from 2024.
- Fairfax County’s poverty rate dropped from 6.6% in 2014 to 5.9% in 2024.
- Among the county’s nine magisterial districts, Mason District has the second-highest population density, at 8.3 people per acre. Providence has a density of 9.1 per acre.
- Among planning districts, the Bailey’s Planning District is the densest, with 11.1 people per acre.
- The population of Mason District was 124,439 in 2025 and is projected to climb to 128,314 in 2035 and 141,070 in 2055.
- Mason District has by far the oldest housing stock among the county’s nine districts; 56.4% of the units in Mason were built before 1970, compared to 25.4% countywide.
The average monthly rent for multifamily housing has climbed from $1,787 in 2020 to $2,092 in 2024. That’s about 4% PER YEAR. The Median Home Value has increased by 6.2% per year over the same period.
That’s a clear indicator of how much new housing stock is needed in the area (and region as a whole).
This is not far off from what the national average increase is year by year though.
The state and county emphasized all the glorious benefits of the Silver Line Metro expansion. Looking at WMATA data, many of the silver line stations have some of the lowest daily usage. How about the county start pushing affordable housing/multifamily to the far west – where property is cheaper to acquire. Rather than continuing to push high density development closer in. Start to get some return on the huge investment in the Silver line.
This would also help with lowering overcrowding in school in the overpopulated (due to the high density housing that really seems to be packed in closer to the beltway vs western FFX).
If the cost to operate or maintain old housing like Wedgewood is too high(we see the same failed heat and cooling story every year), build new further west with both new reliable and more efficient services and then either demolish or full reno.
Here is what I would like to know: How much (and what percentage) of the Fairfax County’s total budget goes to each of the magisterial districts? With Mason District having the oldest housing stock and oldest infrastructure, how much of total annual tax revenues from Fairfax County get spent in Mason District, in terms of total amount, the percentage of the total, and per capita? I would really like to know if the 124,500 residents of Mason District are getting our fair share, as the more western districts seem to have far better Council representation and better investments in infrastructure and services. I’ll click on the link to the report to see if it addresses this question, but I doubt that it does. Our Mason District Representative should be letting us know about these things, but he’s out to lunch. And, our Fairfax County real-estate tax bill is outrageous. There is a terrible spending problem in our county and nobody seems to want to address it.